head(higher_ed[,1:100])Critique and Create Project 2: Distributions
Introduction
As with the first project, you’re being asked to critique a series of visualizations and then to apply best practices as you create your own. Follow along below, but ultimately do the work using the corresponding .qmd file on Posit Cloud
This project’s data
The code chunk above gets you started by loading the required packages and data. Run it (ignoring any warnings), then take a look at higher_ed to understand what it includes. This data is modified slightly from the U.S. Department of Education’s College Scorecard, here: https://collegescorecard.ed.gov/data/. Only 6 rows and 100 columns are shown here, but the full set we’re using has over 2,000 rows and 2,000 columns.
This data is modified slightly from the U.S. Department of Education’s College Scorecard, found here: https://collegescorecard.ed.gov/data/.
Assignment
Respond to the three Critique questions, then finish the two Create code chunks below, and finish with a Self-Critique.
Critique
As an example, I’ll show two visualizations of distributions that can be drawn from this data set. The polished visualization doesn’t show you the code used to create it; instead, much of the relevant code is sprinkled throughout the distributions methods page. As you critique, consider how the visualizations were made, and try to think about why each visualization is well made or poorly well made.
Rough figure
Start by considering this rough figure, including how clear and useful it might be:
higher_ed |>
  ggplot(aes(x = ADM_RATE_ALL,
             y = REGION)) +
  geom_density_ridges()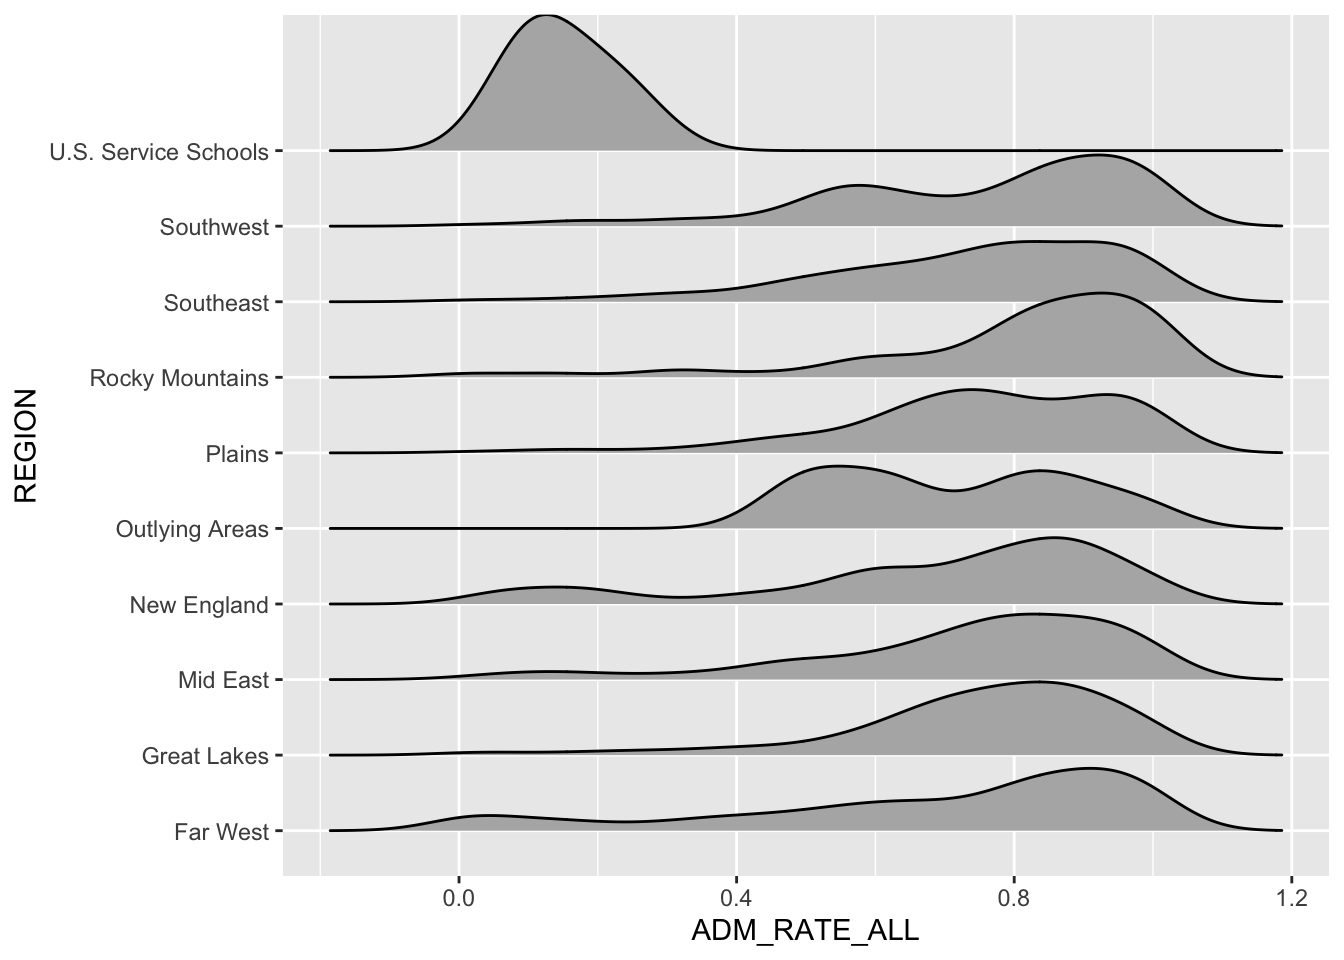
This chart starts shows the distributions of admissions rates in colleges from different regions across the United States. In what ways is it a good visualization? In what ways is it lacking? (No need to answer these!)
Compare this chart to the polished version to answer questions in the next two sections.
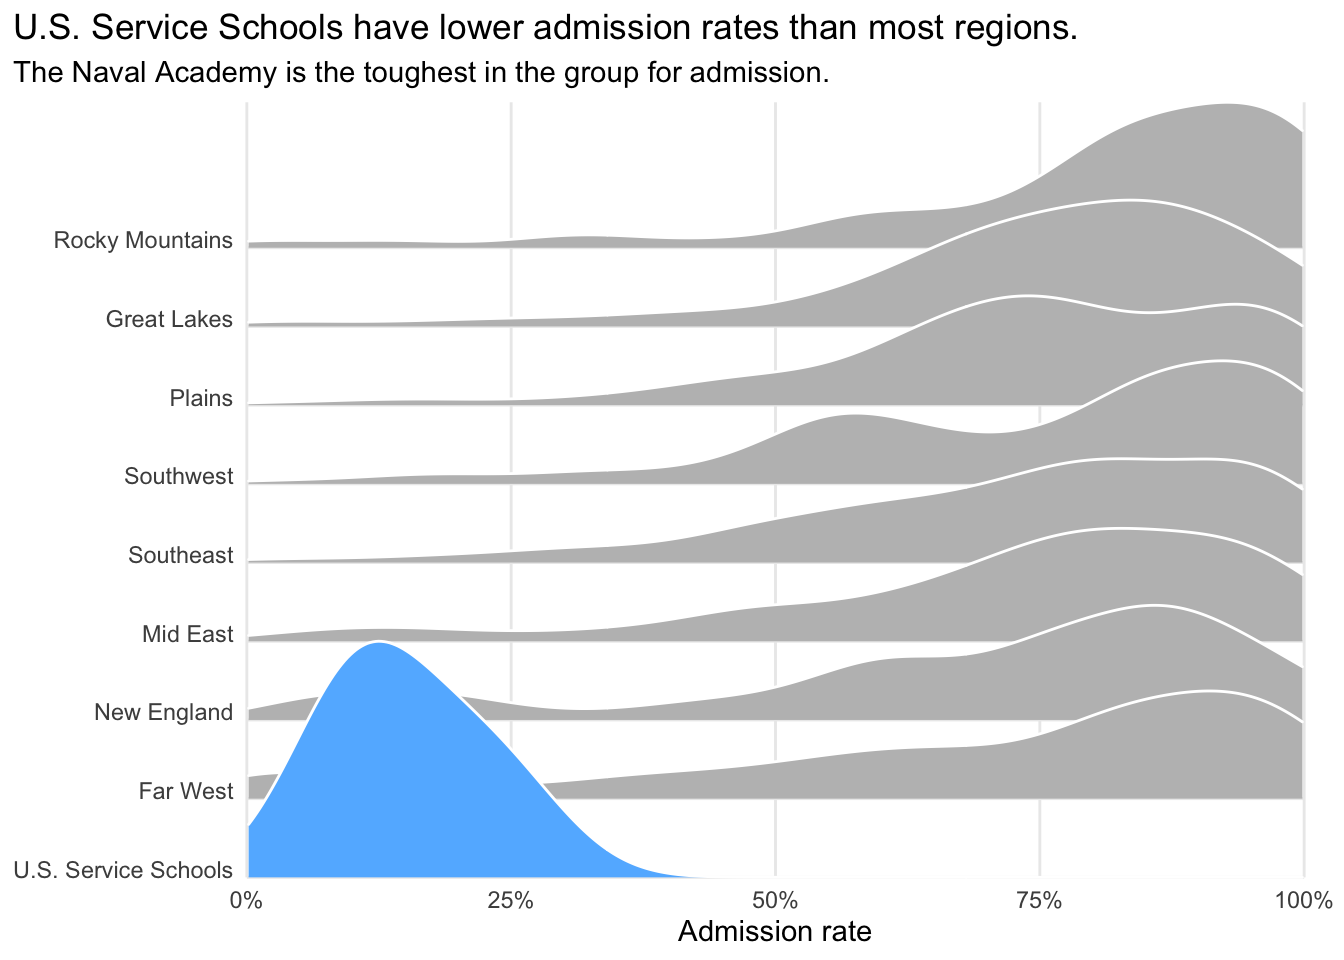
Polished figure
This polished figure makes some clear decisions in shaping the narrative around the data being shown. As you compare it to the previous chart, think about the ways it is changed and how these changes affect the viewer’s ability to understand and respond to the story being told about the data set.
Critique the visualization
There are many differences between these two versions of the figure. Consider how the changes improve or weaken the viewer’s understanding of what they’re being shown.
You respond
When you answer the following questions, it might be helpful to consider not only Wilke’s chapters on distribution, including chapters 7 and 9, but also chapter 4 on color, chapter 22 on labels, chapter 23 on balancing data and context, and chapter 29 on telling a story:
- In what noticeable ways has the polished version improved upon the rough draft?
- Which of these changes do you think made the biggest difference? How do they affect the viewer’s experience?
- Is there anything you see that could still be improved?
Create
Recreating a visualization
Taking inspiration from the above, use the higher_ed data set to try to emulate the polished version as much as possible. This is a stretch goal, and you’ll probably not be able to recreate every element. Don’t be discouraged!
You code
Write code to recreate this polished figure as closely as you can.
Creating your own visualization
Do something brand new with the data to show a distribution of values. Maybe you’ll make a histogram or a box plot. Maybe you’ll show a sina plot or violin plot. Maybe you’ll choose a different column than REGION, like LOCALE_TYPE. You get to choose! Your final product doesn’t have to be as fully polished as the Polished figure shown above, but it does have to be your figure, and it should be made by taking into consideration the relative strengths and weaknesses of the visualization you’ve just recreated.
You code
Write code to make your own figure, and polish it as much as you’re able.
Self-Critique
It’s helpful to learn how to acknowledge the things in our own work that we’re proud of, just as it is good to be able to point out weaker points. Reflecting through self critique is a valuable way to grow in any skill.
You respond
Explain your process and goals for the visualization you created. Critique it, including describing things that you wish you could do but that you don’t yet know how. Write at least a paragraph.